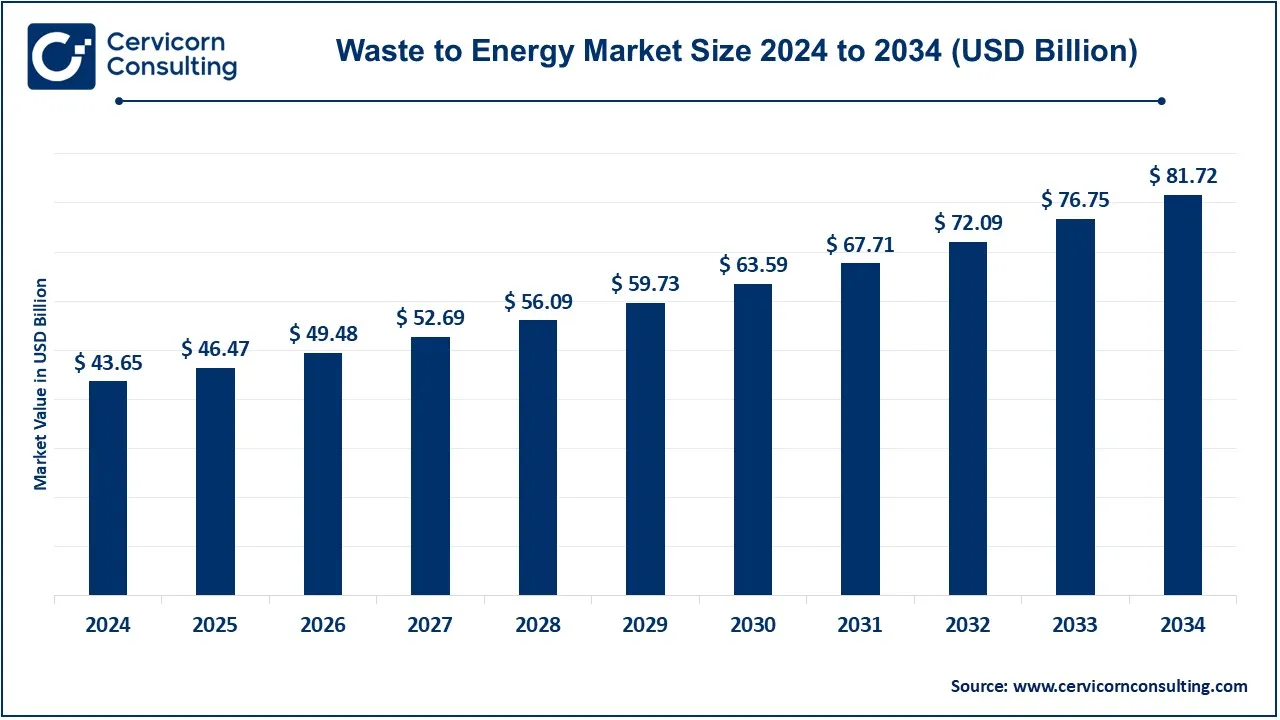
The global waste to energy market size was accounted for USD 43.65 billion in 2024 and is expected to be worth around USD 81.72 billion by 2034, growing at a compound annual growth rate (CAGR) of 6.47% from 2025 to 2034. The Waste-to-Energy (WTE) market has been growing due to increasing waste generation, urbanization, and the need for alternative energy sources. Governments worldwide are implementing strict regulations on landfill usage, pushing for more sustainable waste management. The shift towards renewable energy and concerns over climate change have further boosted WTE adoption. Advancements in WTE technology, such as improved energy conversion efficiency and lower emissions, are driving market expansion. Europe and Asia-Pacific are leading in WTE adoption, with China, India, and Japan investing heavily in infrastructure.

Waste-to-energy (WtE) is a process that converts non-recyclable waste materials into usable forms of energy, typically electricity or heat, through various technologies like incineration, gasification, and anaerobic digestion. This method reduces the volume of waste sent to landfills while producing renewable energy, making it a valuable solution for waste management and energy generation. WtE plants help mitigate greenhouse gas emissions by diverting waste from landfills, where it would otherwise decompose and release methane, a potent greenhouse gas.
Key insights beneficial to the Waste-to-Energy (WTE) market
Report Scope
| Area of Focus | Details |
| Market Size in 2024 | USD 43.65 Billion |
| Expected Market Size in 2034 | USD 81.72 Billion |
| CAGR (2025 to 2034) | 6.47% |
| Leading Region | Europe |
| Fastest Growing Region | Asia-Pacific |
| Key Segments | Waste Type, Technology, Application, Region |
| Key Companies | Mitsubishi Heavy Industries Ltd, Waste Management Inc., A2A SpA, Veolia Environment SA, Hitachi Zosen Corp., MVV Energie AG, Martin GmbH, Babcock & Wilcox Enterprises Inc., Zheng Jinjiang Environment Holding Co. Limited, Suez Group, Xcel Energy Inc., Wheelabrator Technologies Inc., Covanta Holding Corp., China Everbright International Limited. |
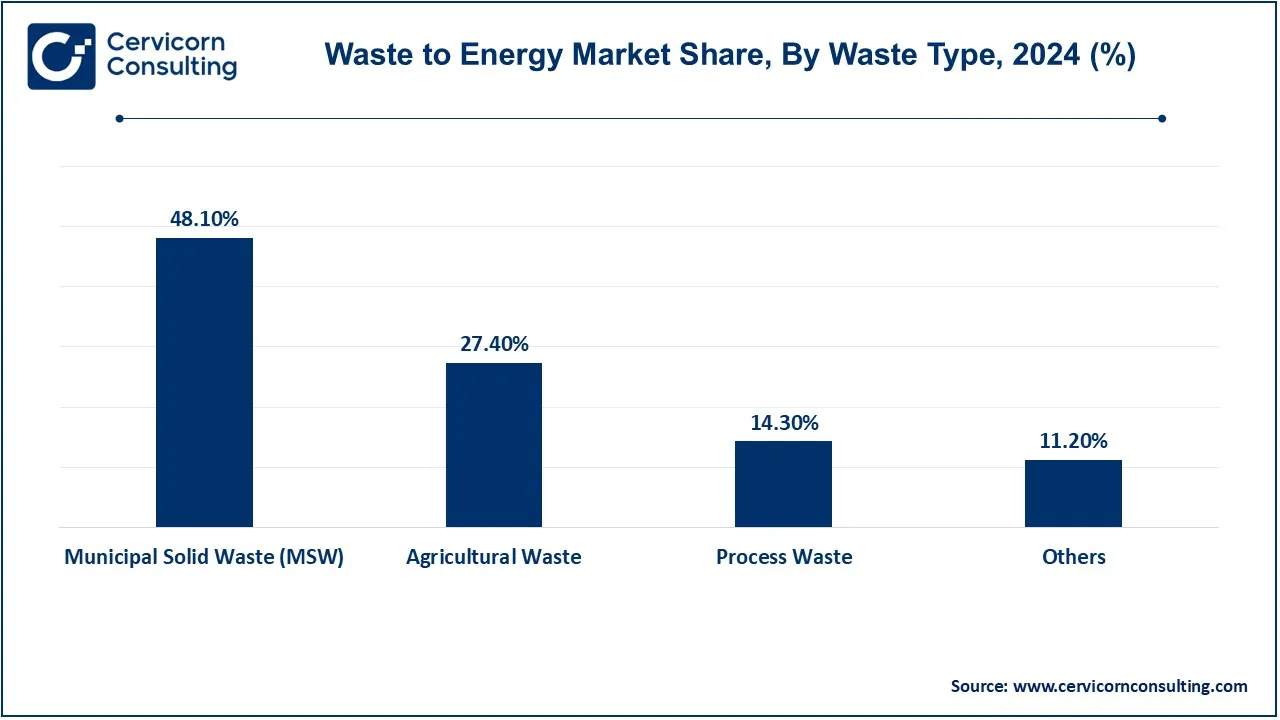
The waste to energy market is segmented into waste type, technology, application and region. Based on waste type, the market classified into municipal solid waste (MSW), agricultural waste, process waste and others. Based on technology, the market classified into thermochemical, incineration, pyrolysis & gasification and biochemical. Based on application, the market classified into electricity, heat and others.
Municipal Solid Waste (MSW): The Municipal Solid Waste (MSW) segment has dominated the market in 2024. Consists of general waste generated through various household and business activities and is collected by a municipality. This waste includes things like scraps of food, papers, plastics, metals as well as other non-hazardous materials. WtE plants use MSW as their main feedstock by burning or melting this type of waste in order to create energy. WtE development optimizes MSW handling by escalading means of energy generation while reducing the amount of waste directed to landfills.

Agricultural Waste: This consists of organic waste associated with agriculture and includes residues of crops, animal dung and processing wastes. Bioenergy can be derived from agricultural waste such as through anaerobic infection or bio burn incineration. WtE solves the issues of reducing agricultural waste by giving value to agricultural waste for energy needs within rural areas.
Others: Includes include industrial waste, medical waste, and waste that is hazardous, as well as waste which cannot be recycled. These waste types are typically dealt with by advanced WtE processes, such as its gasification or pyrolysis, for safe energy recovery with controlled release of poisonous materials.
Electricity: Waste-to-energy (WtE) processes convert or combust waste to generate energy in the form of electricity which can be fed in the grid or utilized for consumption at the end-use site. In most of the cases, electricity generation is the use of WtE as a common need. These facilities prevent the burning of more fuel which fossil fuels and generates renewable power from waste.
Waste to Energy Market Revenue Share, By Application, 2024 (%)
| Application | Revenue Share, 2024 (%) |
| Electricity | 56% |
| Heat | 32% |
| Others | 12% |
Heat: Heat resulting from waste combustion is used for district heating systems of industrial activities. In some countries, WtE facilities are associated with district systems and provide heat energy to households for heating or production activities as required. This dual production of heat and electricity enhances the effectiveness of WtE activities.
The waste to energy market is segmented into several key regions: North America, Europe, Asia-Pacific, and LAMEA (Latin America, Middle East, and Africa). The Europe region has dominated the market in 2024.
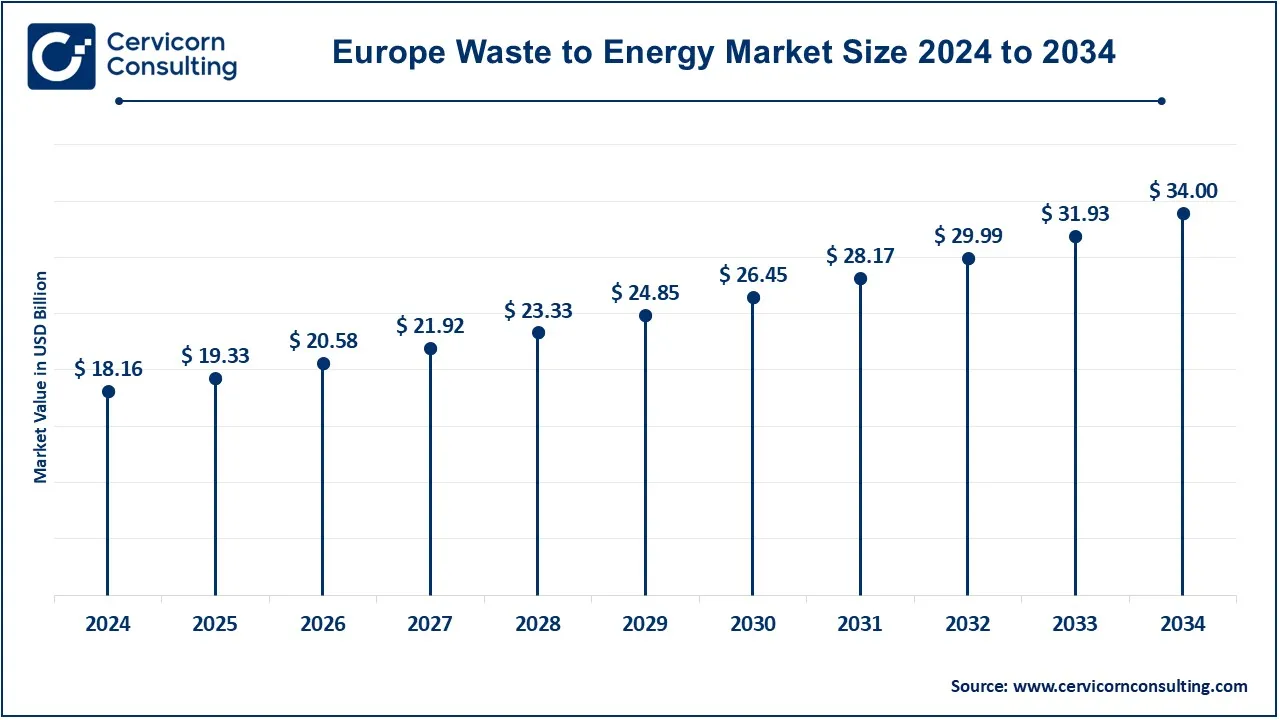
The Europe waste to energy market size was estimated at USD 18.16 billion in 2024 and is projected to hit around USD 34 billion by 2034. Europe - At the very fewest, WtE sector is in the hands of Europe, where countries such as Germany, Sweden and the Netherlands are making huge investments in WTE generation systems. The European region has capitalized on aggressive promotion, as well as put policies in place that require waste to be disposed of in certain ways, which make municipalities mostly wastewater treatment facility. This opportunity is even more enhanced by the fact that WTE is regarded as one of the energy options in Europe, considering the European Commission’s Strategy on Waste. Waste to energy (WtE) incineration in Europe has a number of advantages over landfills more advanced technologies as well as lack of public awareness and acceptance. Disposal as well as commercial losses attends to note due to conventional and effective recycling methods that already exist and operate in the countries of her development. In some regions, waste to energy plant expansion efforts may also be compromised by anti-incineration sentiment and environmental regulations that limit emissions.

The North America waste to energy market size was valued at USD 8.82 billion in 2024 and is expected to be worth around USD 16.51 billion by 2034. North America especially the US and Canada is one of the regions with advanced waste-to-energy technology and waste management policies. This trend in the region is attributed to growing concern in the public about how to manage wastes through measures taken by environmental policies which are so tough that stresses on how wastes are disposed off. Moreover, the provision of a number of federal and state level incentives along with policies encouraging the undertaking of projects of renewable energy sources creates a conducive environment for the investment in waste to energy technologies. Nevertheless, there are some drawbacks such as the fact that construction of WTE plants necessitates huge investment which deters most investors and the fact that the public has a negative perception on waste incineration owing to existing health hazards from such operations. Furthermore, high recycling rates tend to limit or reduce the need for WTE systems, which can also affect the market growth.
The Asia-Pacific waste to energy market size was accounted for USD 12.53 billion in 2024 and is predicted to surpass around USD 23.45 billion by 2034. The Asia-Pacific region is experiencing rapid growth, driven by increasing urbanization, industrialization, and a corresponding rise in waste generation. Countries like China, India, and Japan are leading the charge, implementing government initiatives aimed at improving waste management systems to address the escalating energy demands of their growing populations. The focus on sustainability and environmental conservation is further propelling investments in WtE technologies. However, this region faces several challenges, including limited public awareness of WtE benefits and a lack of technical expertise necessary for advanced waste conversion technologies. Additionally, varying regulatory frameworks across countries can create complexities for market players. Moreover, the continued reliance on cheaper landfill options in many developing countries poses a significant challenge to the widespread adoption of WtE solutions.
Waste to Energy Market Revenue Share, By Region, 2024 (%)
| Region | Revenue Share, 2024 (%) |
| North America | 20.20% |
| Europe | 41.60% |
| Asia-Pacific | 28.70% |
| LAMEA | 9.50% |
The LAMEA waste to energy market was valued at USD 4.15 billion in 2024 and is anticipated to reach around USD 7.76 billion by 2034. The LAMEA region is still in its emerging stages, with countries actively exploring WtE technologies as a means to manage growing waste and energy demands. Urbanization and increasing energy costs are significant factors driving this interest, prompting governments in regions such as Brazil, South Africa, and the UAE to consider WtE as a sustainable waste management strategy. Additionally, international partnerships and funding from development banks are helping to facilitate the development of WtE projects, bolstering market growth. However, the region faces several challenges, including economic instability, a lack of adequate waste management infrastructure, and limited public acceptance of WtE technologies. The reliance on traditional waste disposal methods, coupled with insufficient investment in advanced waste treatment technologies, can hinder the market’s expansion in LAMEA. Thus, overcoming these challenges will be essential for unlocking the full potential of the Waste-to-Energy market in these regions.
CEO Statements
Eric M. Stein – CEO of Fortistar
Aidan O’Brien, CEO of Covanta
Antoine Frérot, CEO of Veolia
Market Segmentation
By Waste Type
By Technology
By Application
By Region
Chapter 1. Market Introduction and Overview
1.1 Market Definition and Scope
1.1.1 Overview of Waste to Energy
1.1.2 Scope of the Study
1.1.3 Research Timeframe
1.2 Research Methodology and Approach
1.2.1 Methodology Overview
1.2.2 Data Sources and Validation
1.2.3 Key Assumptions and Limitations
Chapter 2. Executive Summary
2.1 Market Highlights and Snapshot
2.2 Key Insights by Segments
2.2.1 By Waste Type Overview
2.2.2 By Technology Overview
2.2.3 By Application Overview
2.3 Competitive Overview
Chapter 3. Global Impact Analysis
3.1 COVID 19 Impact on Waste to Energy Market
3.1.1 COVID-19 Landscape: Pre and Post COVID Analysis
3.1.2 COVID 19 Impact: Global Major Government Policy
3.1.3 Market Trends and Opportunities in the COVID-19 Landscape
3.2 Russia-Ukraine Conflict: Global Market Implications
3.3 Regulatory and Policy Changes Impacting Global Markets
Chapter 4. Market Dynamics and Trends
4.1 Market Dynamics
4.1.1 Market Drivers
4.1.1.1 Improvement in Biomass Use
4.1.1.2 Effective Cost Waste Management Awareness
4.1.1.3 Evolution of Smart City Initiative
4.1.2 Market Restraints
4.1.2.1 Investment in Construction of Waste to Energy Facilities is High
4.1.2.2 Operational and Maintenance Costs are High
4.1.2.3 Environmental Protection Laws are Too Strict
4.1.3 Market Challenges
4.1.3.1 Implementation of Various Waste-to-Energy Technologies
4.1.3.2 Challenges of Waste Operations
4.1.3.3 Threat of Competing Forms of Renewable Energy
4.2 Market Trends
Chapter 5. Premium Insights and Analysis
5.1 Global Waste to Energy Market Dynamics, Impact Analysis
5.2 Porter’s Five Forces Analysis
5.2.1 Bargaining Power of Suppliers
5.2.2 Bargaining Power of Buyers
5.2.3 Threat of Substitute Products
5.2.4 Rivalry among Existing Firms
5.2.5 Threat of New Entrants
5.3 PESTEL Analysis
5.4 Value Chain Analysis
5.5 Product Pricing Analysis
5.6 Vendor Landscape
5.6.1 List of Buyers
5.6.2 List of Suppliers
Chapter 6. Waste to Energy Market, By Waste Type
6.1 Global Waste to Energy Market Snapshot, By Waste Type
6.1.1 Market Revenue (($Billion) and Growth Rate (%), 2022-2034
6.1.1.1 Municipal Solid Waste (MSW)
6.1.1.2 Agricultural Waste
6.1.1.3 Process Waste
6.1.1.4 Others
Chapter 7. Waste to Energy Market, By Technology
7.1 Global Waste to Energy Market Snapshot, By Technology
7.1.1 Market Revenue (($Billion) and Growth Rate (%), 2022-2034
7.1.1.1 Thermochemical
7.1.1.2 Incineration
7.1.1.3 Pyrolysis & Gasification
7.1.1.4 Biochemical
Chapter 8. Waste to Energy Market, By Application
8.1 Global Waste to Energy Market Snapshot, By Application
8.1.1 Market Revenue (($Billion) and Growth Rate (%), 2022-2034
8.1.1.1 Electricity
8.1.1.2 Heat
Chapter 9. Waste to Energy Market, By Region
9.1 Overview
9.2 Waste to Energy Market Revenue Share, By Region 2024 (%)
9.3 Global Waste to Energy Market, By Region
9.3.1 Market Size and Forecast
9.4 North America
9.4.1 North America Waste to Energy Market Revenue, 2022-2034 ($Billion)
9.4.2 Market Size and Forecast
9.4.3 North America Waste to Energy Market, By Country
9.4.4 U.S.
9.4.4.1 U.S. Waste to Energy Market Revenue, 2022-2034 ($Billion)
9.4.4.2 Market Size and Forecast
9.4.4.3 U.S. Market Segmental Analysis
9.4.5 Canada
9.4.5.1 Canada Waste to Energy Market Revenue, 2022-2034 ($Billion)
9.4.5.2 Market Size and Forecast
9.4.5.3 Canada Market Segmental Analysis
9.4.6 Mexico
9.4.6.1 Mexico Waste to Energy Market Revenue, 2022-2034 ($Billion)
9.4.6.2 Market Size and Forecast
9.4.6.3 Mexico Market Segmental Analysis
9.5 Europe
9.5.1 Europe Waste to Energy Market Revenue, 2022-2034 ($Billion)
9.5.2 Market Size and Forecast
9.5.3 Europe Waste to Energy Market, By Country
9.5.4 UK
9.5.4.1 UK Waste to Energy Market Revenue, 2022-2034 ($Billion)
9.5.4.2 Market Size and Forecast
9.5.4.3 UKMarket Segmental Analysis
9.5.5 France
9.5.5.1 France Waste to Energy Market Revenue, 2022-2034 ($Billion)
9.5.5.2 Market Size and Forecast
9.5.5.3 FranceMarket Segmental Analysis
9.5.6 Germany
9.5.6.1 Germany Waste to Energy Market Revenue, 2022-2034 ($Billion)
9.5.6.2 Market Size and Forecast
9.5.6.3 GermanyMarket Segmental Analysis
9.5.7 Rest of Europe
9.5.7.1 Rest of Europe Waste to Energy Market Revenue, 2022-2034 ($Billion)
9.5.7.2 Market Size and Forecast
9.5.7.3 Rest of EuropeMarket Segmental Analysis
9.6 Asia Pacific
9.6.1 Asia Pacific Waste to Energy Market Revenue, 2022-2034 ($Billion)
9.6.2 Market Size and Forecast
9.6.3 Asia Pacific Waste to Energy Market, By Country
9.6.4 China
9.6.4.1 China Waste to Energy Market Revenue, 2022-2034 ($Billion)
9.6.4.2 Market Size and Forecast
9.6.4.3 ChinaMarket Segmental Analysis
9.6.5 Japan
9.6.5.1 Japan Waste to Energy Market Revenue, 2022-2034 ($Billion)
9.6.5.2 Market Size and Forecast
9.6.5.3 JapanMarket Segmental Analysis
9.6.6 India
9.6.6.1 India Waste to Energy Market Revenue, 2022-2034 ($Billion)
9.6.6.2 Market Size and Forecast
9.6.6.3 IndiaMarket Segmental Analysis
9.6.7 Australia
9.6.7.1 Australia Waste to Energy Market Revenue, 2022-2034 ($Billion)
9.6.7.2 Market Size and Forecast
9.6.7.3 AustraliaMarket Segmental Analysis
9.6.8 Rest of Asia Pacific
9.6.8.1 Rest of Asia Pacific Waste to Energy Market Revenue, 2022-2034 ($Billion)
9.6.8.2 Market Size and Forecast
9.6.8.3 Rest of Asia PacificMarket Segmental Analysis
9.7 LAMEA
9.7.1 LAMEA Waste to Energy Market Revenue, 2022-2034 ($Billion)
9.7.2 Market Size and Forecast
9.7.3 LAMEA Waste to Energy Market, By Country
9.7.4 GCC
9.7.4.1 GCC Waste to Energy Market Revenue, 2022-2034 ($Billion)
9.7.4.2 Market Size and Forecast
9.7.4.3 GCCMarket Segmental Analysis
9.7.5 Africa
9.7.5.1 Africa Waste to Energy Market Revenue, 2022-2034 ($Billion)
9.7.5.2 Market Size and Forecast
9.7.5.3 AfricaMarket Segmental Analysis
9.7.6 Brazil
9.7.6.1 Brazil Waste to Energy Market Revenue, 2022-2034 ($Billion)
9.7.6.2 Market Size and Forecast
9.7.6.3 BrazilMarket Segmental Analysis
9.7.7 Rest of LAMEA
9.7.7.1 Rest of LAMEA Waste to Energy Market Revenue, 2022-2034 ($Billion)
9.7.7.2 Market Size and Forecast
9.7.7.3 Rest of LAMEAMarket Segmental Analysis
Chapter 10. Competitive Landscape
10.1 Competitor Strategic Analysis
10.1.1 Top Player Positioning/Market Share Analysis
10.1.2 Top Winning Strategies, By Company, 2022-2024
10.1.3 Competitive Analysis By Revenue, 2022-2024
10.2 Recent Developments by the Market Contributors (2024)
Chapter 11. Company Profiles
11.1 Mitsubishi Heavy Industries Ltd
11.1.1 Company Snapshot
11.1.2 Company and Business Overview
11.1.3 Financial KPIs
11.1.4 Product/Service Portfolio
11.1.5 Strategic Growth
11.1.6 Global Footprints
11.1.7 Recent Development
11.1.8 SWOT Analysis
11.2 Waste Management Inc.
11.3 A2A SpA
11.4 Veolia Environment SA
11.5 Hitachi Zosen Corp.
11.6 MVV Energie AG
11.7 Martin GmbH
11.8 Babcock & Wilcox Enterprises Inc.
11.9 Zheng Jinjiang Environment Holding Co. Limited
11.10 Suez Group
11.11 Xcel Energy Inc.
11.12 Wheelabrator Technologies Inc.
11.13 Covanta Holding Corp.
11.14 China Everbright International Limited.